Where are liquidations stacked above and below the current price? If Bitcoin spikes or dumps, how far could it run before the forced closing runs out?
A liquidation map is the chart you open to answer those questions. It’s also easy to misread. Here’s how I read it, what each part means, and where it stops being useful, so you can check it yourself and decide what to do with it.
What does a liquidation map actually show?
Trade Bitcoin futures with leverage and your exchange will close your position automatically once your losses eat through your margin. That forced closing is a liquidation.
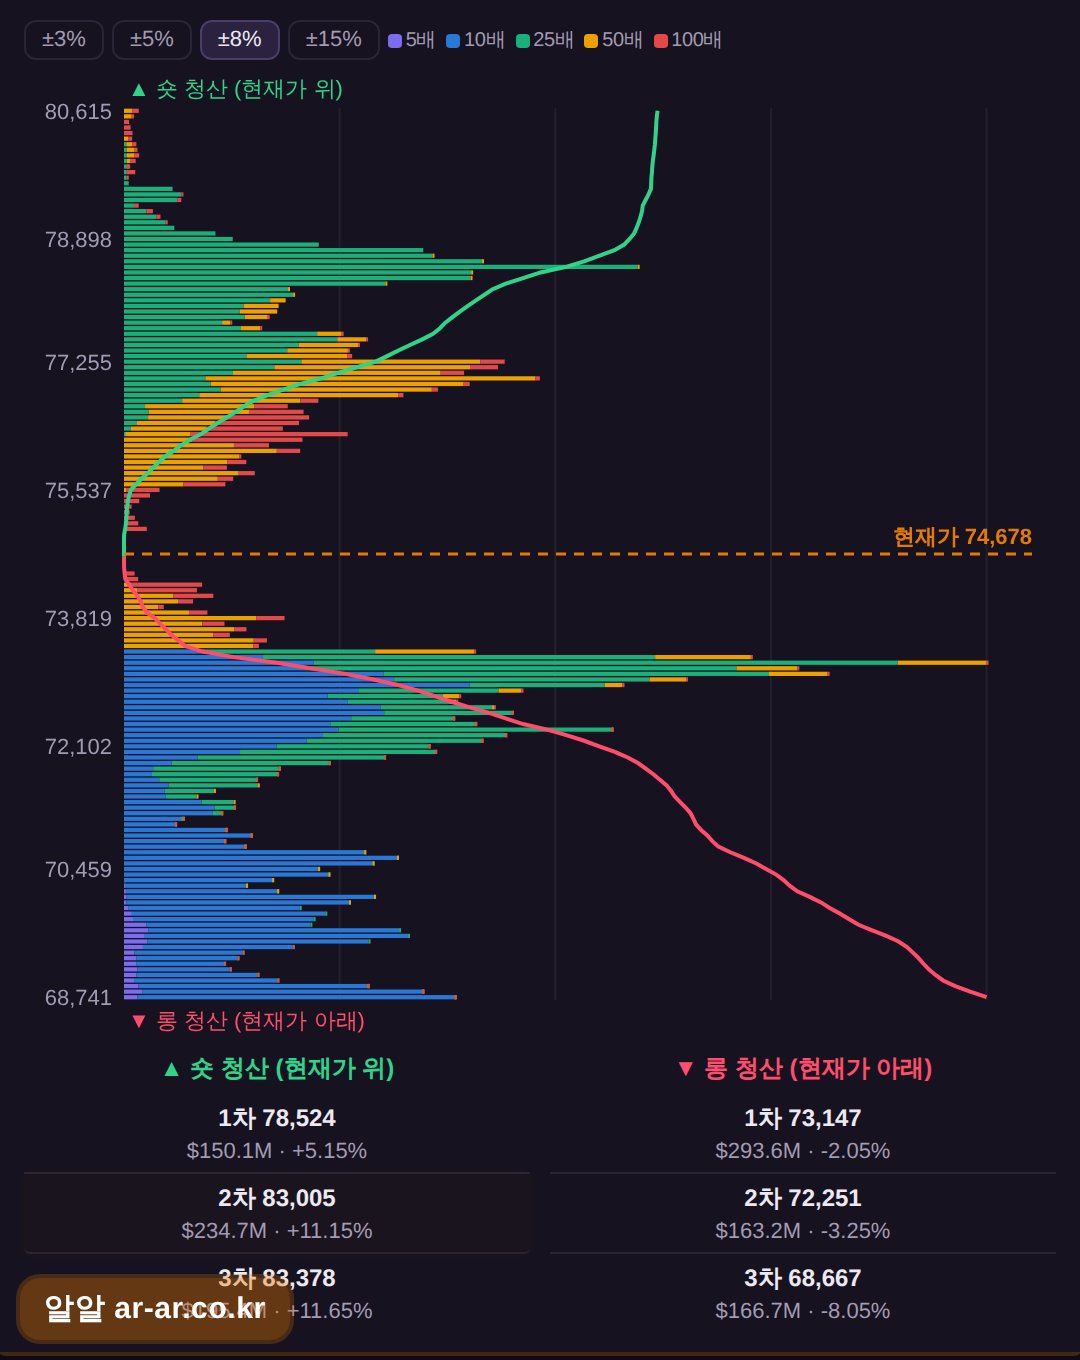
A liquidation map estimates at which price levels leveraged positions would be forced out, and roughly how large those clusters are. Longs get liquidated when price falls, so their levels sit below the current price. Shorts get liquidated when price rises, so theirs sit above. Looking at the map, you’re really asking two things: how big are the clusters on each side, and how far away are they?
The most important point is that these are estimates, not a public list of positions. Exchanges don’t publish every trader’s entry price and leverage. Liquidation maps are modeled from data such as open interest, price history, and assumptions about common leverage levels. Providers make different assumptions, so two maps can look different on the same day. Treat the picture as a rough sketch of where leverage is concentrated, not an exact ledger.
Why do the clusters matter?
A liquidation isn’t just a closed position. The exchange has to close it by trading, selling a forced long or buying back a forced short, and that order lands in the market on top of whatever else is happening.
If many liquidation levels sit close together, price moving into that zone can set off a chain reaction. Liquidated longs push price down, which hits more long liquidation levels, which pushes price down further. Shorts work the same way in reverse. This is usually called a liquidation cascade, or a squeeze, and it’s why a big cluster is worth knowing about.
It also explains why some sharp moves happen fast and look out of proportion to the news. Often the move is leveraged positions being unwound, not fresh buying or selling pressure.
How do I read it step by step?
Start with the current price, because everything on the map is relative to it. Longs sit below, shorts above.
Then compare the two sides. Is there a much larger stack of estimated liquidations on one side? A bigger cluster means more forced closing if price reaches it. It doesn’t mean price will go there.
Distance comes next. A large cluster very close to price matters more in the short term than a large one far away, which may only matter after a bigger move.
Look at the shape too, not just the tallest bar. A narrow spike and a broad, spread-out zone behave differently. A spike is a specific level that might get hit, while a broad zone is a region where forced closing could keep feeding in as price moves through it.
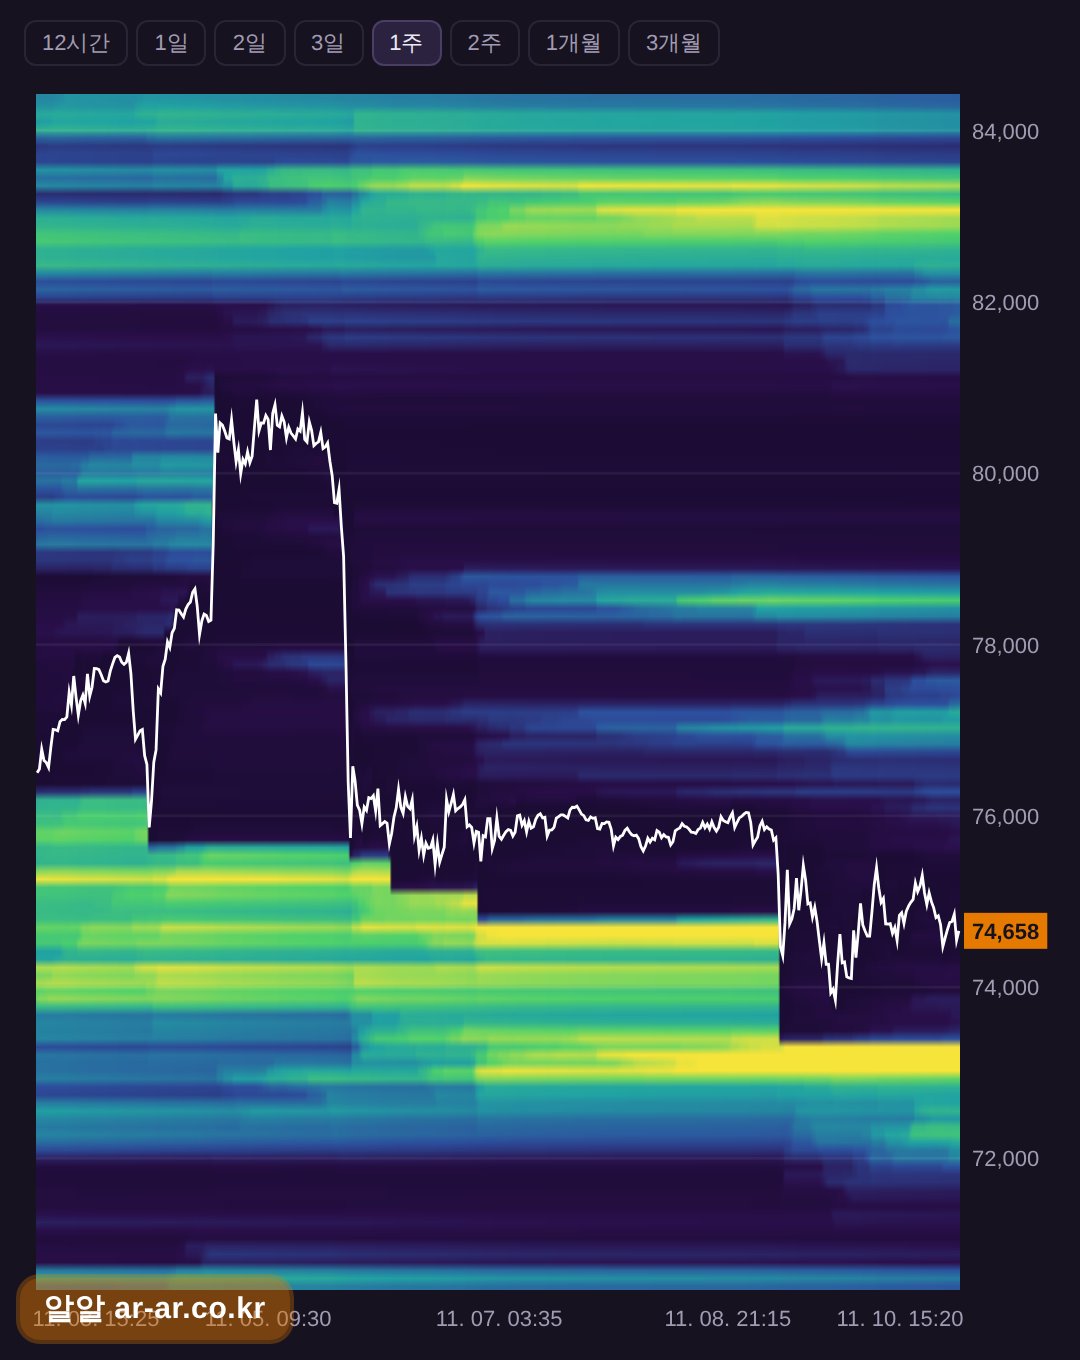
Finally, use the heatmap to see change over time. A static map is a snapshot, but a liquidation heatmap shows how these levels built up and, importantly, which ones have already been triggered and cleared. A cluster that price already swept through is no longer a live target, and checking history keeps you from treating old levels as current ones.
What can’t the map tell me?
I’d rather say this plainly than oversell the tool.
It doesn’t predict direction. A big cluster above price doesn’t mean price goes up to hit it, and a cluster below doesn’t mean a drop is coming. It tells you where forced orders may land if price gets there.
Price can also ignore a cluster. It can approach a level, stall, and turn around. The cluster may be smaller than estimated, or the owners may have closed or adjusted their positions beforehand. And since the models guess at leverage and position size, real positions can differ from what’s drawn.
Liquidity matters as well: the same amount of forced selling moves a thin order book more than a deep one.
A map is one input. Used alone, it’s tempting to over-read.
What should I check alongside it?
A cluster means more when other data points the same way. Open interest is the total of outstanding futures positions. If it’s rising, more leverage is being added and the liquidation clusters may be growing, while falling OI can mean positions are being closed or liquidated. The funding rate, the periodic payment between longs and shorts on perpetual futures, can show which side is crowded when it’s strongly one-sided. The long/short ratio of large traders shows how bigger accounts are positioned, which helps you judge which side’s liquidations might be larger. The Fear & Greed index and the economic calendar add context on sentiment and on scheduled events that can move price and trigger liquidations.
The question to answer isn’t “where will price go?” but “if price moves, which side is more exposed, and is leverage building or being cleared?”
Where can I check this on RR?
I built RR as a free set of market data screens, the same kind I wanted open while trading. The liquidation map and heatmap page shows the estimated liquidation levels above and below the current price without signing up for anything. The site is available in English and is free.
The RR home page also has funding rates, open interest, the Fear & Greed index, Bitcoin dominance, the long/short ratio of large traders, Bitcoin ETF inflows and outflows, and an economic calendar, so you can do the cross-checks above in one place. There’s a paper-trading mode too, if you want to test how you’d react to a move without risking money.
Here’s a simple routine to try. Open the liquidation map and note which side has the larger and closer cluster. Check the heatmap to see whether those levels are still untouched, then compare with funding and OI. Form your own view from there.
FAQ
Is a Bitcoin liquidation map accurate?
It’s an estimate built from market data and assumptions about leverage, not a list of real positions. Use it to see where leverage is likely concentrated, and expect different providers to show somewhat different pictures.
Does a big liquidation cluster mean price will move there?
No. It shows where forced orders could occur if price reaches that level; it doesn’t say whether price will get there. Price can stop short of a cluster or ignore it.
Do I need to sign up to view the liquidation map on RR?
No. RR is free and doesn’t require registration, and it’s available in English.
This is general information, not investment advice.