Author: 알알

  • How to Read a Bitcoin Liquidation Map (and What It Can’t Tell You)

    Where are liquidations stacked above and below the current price? If Bitcoin spikes or dumps, how far could it run before the forced closing runs out?

    A liquidation map is the chart you open to answer those questions. It’s also easy to misread. Here’s how I read it, what each part means, and where it stops being useful, so you can check it yourself and decide what to do with it.
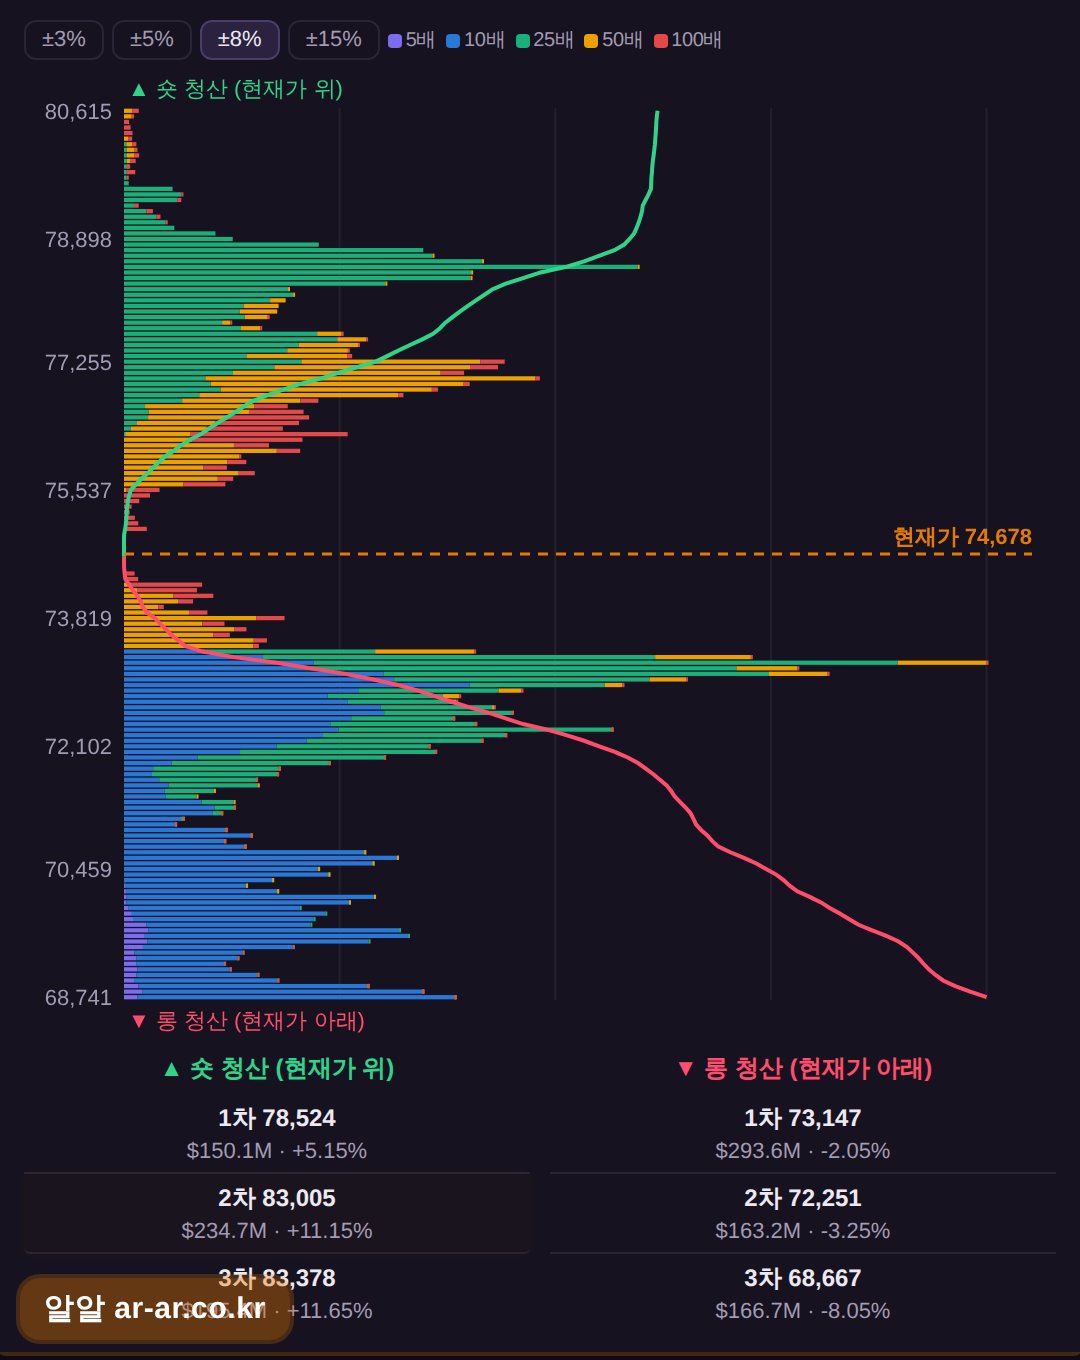
    RR liquidation map (as of 2026-11-10)
    RR liquidation map (as of 2026-11-10)

    What does a liquidation map actually show?

    Trade Bitcoin futures with leverage and your exchange will close your position automatically once your losses eat through your margin. That forced closing is a liquidation.

    A liquidation map estimates at which price levels leveraged positions would be forced out, and roughly how large those clusters are. Longs get liquidated when price falls, so their levels sit below the current price. Shorts get liquidated when price rises, so theirs sit above. Looking at the map, you’re really asking two things: how big are the clusters on each side, and how far away are they?

    The most important point is that these are estimates, not a public list of positions. Exchanges don’t publish every trader’s entry price and leverage. Liquidation maps are modeled from data such as open interest, price history, and assumptions about common leverage levels. Providers make different assumptions, so two maps can look different on the same day. Treat the picture as a rough sketch of where leverage is concentrated, not an exact ledger.

    Why do the clusters matter?

    A liquidation isn’t just a closed position. The exchange has to close it by trading, selling a forced long or buying back a forced short, and that order lands in the market on top of whatever else is happening.

    If many liquidation levels sit close together, price moving into that zone can set off a chain reaction. Liquidated longs push price down, which hits more long liquidation levels, which pushes price down further. Shorts work the same way in reverse. This is usually called a liquidation cascade, or a squeeze, and it’s why a big cluster is worth knowing about.

    It also explains why some sharp moves happen fast and look out of proportion to the news. Often the move is leveraged positions being unwound, not fresh buying or selling pressure.

    How do I read it step by step?

    Start with the current price, because everything on the map is relative to it. Longs sit below, shorts above.

    Then compare the two sides. Is there a much larger stack of estimated liquidations on one side? A bigger cluster means more forced closing if price reaches it. It doesn’t mean price will go there.

    Distance comes next. A large cluster very close to price matters more in the short term than a large one far away, which may only matter after a bigger move.

    Look at the shape too, not just the tallest bar. A narrow spike and a broad, spread-out zone behave differently. A spike is a specific level that might get hit, while a broad zone is a region where forced closing could keep feeding in as price moves through it.

    Finally, use the heatmap to see change over time. A static map is a snapshot, but a liquidation heatmap shows how these levels built up and, importantly, which ones have already been triggered and cleared. A cluster that price already swept through is no longer a live target, and checking history keeps you from treating old levels as current ones.

    What can’t the map tell me?

    I’d rather say this plainly than oversell the tool.

    It doesn’t predict direction. A big cluster above price doesn’t mean price goes up to hit it, and a cluster below doesn’t mean a drop is coming. It tells you where forced orders may land if price gets there.

    Price can also ignore a cluster. It can approach a level, stall, and turn around. The cluster may be smaller than estimated, or the owners may have closed or adjusted their positions beforehand. And since the models guess at leverage and position size, real positions can differ from what’s drawn.

    Liquidity matters as well: the same amount of forced selling moves a thin order book more than a deep one.

    A map is one input. Used alone, it’s tempting to over-read.

    What should I check alongside it?

    A cluster means more when other data points the same way. Open interest is the total of outstanding futures positions. If it’s rising, more leverage is being added and the liquidation clusters may be growing, while falling OI can mean positions are being closed or liquidated. The funding rate, the periodic payment between longs and shorts on perpetual futures, can show which side is crowded when it’s strongly one-sided. The long/short ratio of large traders shows how bigger accounts are positioned, which helps you judge which side’s liquidations might be larger. The Fear & Greed index and the economic calendar add context on sentiment and on scheduled events that can move price and trigger liquidations.

    The question to answer isn’t “where will price go?” but “if price moves, which side is more exposed, and is leverage building or being cleared?”

    Where can I check this on RR?

    I built RR as a free set of market data screens, the same kind I wanted open while trading. The liquidation map and heatmap page shows the estimated liquidation levels above and below the current price without signing up for anything. The site is available in English and is free.

    The RR home page also has funding rates, open interest, the Fear & Greed index, Bitcoin dominance, the long/short ratio of large traders, Bitcoin ETF inflows and outflows, and an economic calendar, so you can do the cross-checks above in one place. There’s a paper-trading mode too, if you want to test how you’d react to a move without risking money.

    Here’s a simple routine to try. Open the liquidation map and note which side has the larger and closer cluster. Check the heatmap to see whether those levels are still untouched, then compare with funding and OI. Form your own view from there.
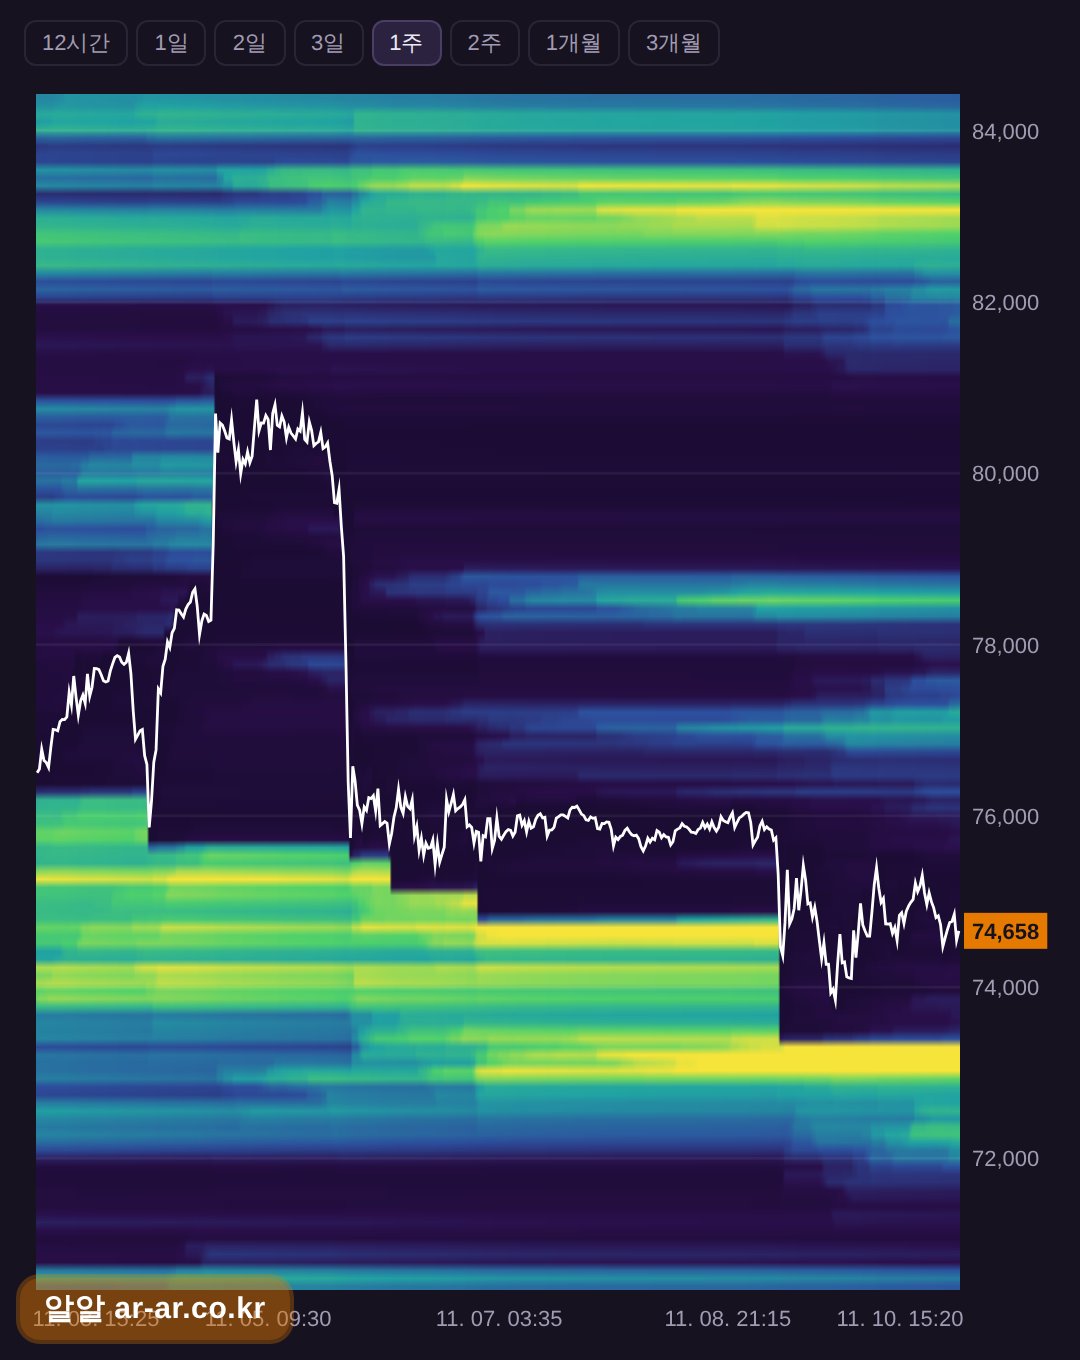
    RR liquidation heatmap (as of 2026-11-10)
    RR liquidation heatmap (as of 2026-11-10)

    FAQ

    Is a Bitcoin liquidation map accurate?
    It’s an estimate built from market data and assumptions about leverage, not a list of real positions. Use it to see where leverage is likely concentrated, and expect different providers to show somewhat different pictures.

    Does a big liquidation cluster mean price will move there?
    No. It shows where forced orders could occur if price reaches that level; it doesn’t say whether price will get there. Price can stop short of a cluster or ignore it.

    Do I need to sign up to view the liquidation map on RR?
    No. RR is free and doesn’t require registration, and it’s available in English.

    This is general information, not investment advice.

  • Futures Fee Comparison: Bybit vs OKX vs Binance vs Bitget (Bybit & Bitget checked 2026-11-07)

    This post contains affiliate links. Bybit and Bitget figures below were checked on 2026-11-07; OKX and Binance base maker/taker fees are not yet verified — check the official page.

    Which futures exchange has the lowest fees? And does a referral discount change that ranking?

    I’ll start with the base rates, then the referral side, and then how to check each number yourself. Fee schedules change, so the official fee pages are linked in the last section.

    What are the base futures fees?

    Here are the standard futures rates in my data for all four exchanges:

    Exchange Futures maker Futures taker
    Bybit 0.02% 0.055%
    OKX 0.02% 0.05%
    Binance 0.02% 0.05%
    Bitget 0.02% 0.06%

    Maker fees are identical. All four list 0.02%, so they can’t separate the exchanges. Taker fees can: OKX and Binance tie at 0.05%, Bybit sits at 0.055%, and Bitget at 0.06%.

    A maker order is a limit order that rests on the order book, while a taker order takes liquidity immediately, like a market order. If you mostly use market orders to get in and out, the taker column is the one to watch. If you mostly place resting limit orders, the four look the same at the base level.

    Spot rates, for reference: Bybit, Binance and Bitget list 0.1% maker and 0.1% taker, while OKX lists 0.08% maker and 0.1% taker. This post is about futures, so I won’t go deeper on spot.

    What do the referral programs offer?

    Each exchange’s referral program has two figures in my data, a discount and a cashback:

    Exchange Discount Cashback
    Bybit 20% 20%
    OKX 20% 10%
    Binance 20% 10%
    Bitget 30% 20%

    The discount is 20% on Bybit, OKX and Binance, and 30% on Bitget. Cashback is 20% on Bybit and Bitget, and 10% on OKX and Binance. Bitget has the highest figure on both, and Bybit matches it on cashback but not on discount.

    So does this change the ranking? I can’t tell from my data how the discount and cashback combine, and that depends on your account tier and the product you trade. I’m not going to multiply them into a made-up “effective fee”. Bitget starts with the highest taker rate, so whether its larger referral figures close the gap is something to check on the exchange’s own page, with your own numbers.

    How is the cashback paid?

    The payout schedule differs, which affects how soon you see the money. Bybit credits 20% of the trading fees you paid in the previous week every Monday, automatically in USDT. OKX credits its 10% cashback to your account once a week, also automatically in USDT. Binance pays its 10% once a week, again automatically. Bitget is the fastest, crediting its 20% cashback automatically 4 times a day.

    If you trade rarely, the schedule hardly matters, and the cashback percentage is what counts.

    What’s different about Bybit?

    Bybit has two extras in my data.

    The first is a welcome bonus. Bybit lists up to $100 for new sign-ups, subject to its new-user event terms, so the amount you get can vary. Read those terms before counting on it.

    The second is adding a code after sign-up. If you registered a main account without any code, you can add an Affiliate code within 14 days of sign-up through “Join an Affiliate’s Community”. Regular user referral codes are not accepted, and once you add a code it cannot be changed. The Bybit code is 30638.

    The other exchanges have no welcome bonus or late-add option in my data.

    Where are the sign-up links and codes?

    These are the official links and codes exactly as I have them:

    If you’re signing up through a referral, use the link or enter the code during registration. For Bybit, the late-add window above is the only way to fix a missed code.

    How can I check these numbers myself?

    Fee tables go out of date, so verify before you commit. Start with the official fee pages, which is where my numbers come from: Bybit trading fee structure, OKX fees, Binance fee FAQ and Bitget fee article.

    Then make sure you’re comparing the same tier. Fee schedules are usually tiered, so look at the default level your account would start on, not a high-volume one. Next, go through your recent orders and count how many were maker and how many were taker, which tells you which fee column deserves more weight. Read each exchange’s referral terms too, including how the discount and cashback apply and whether the discount covers futures.

    Finally, do the arithmetic with your own numbers. Fee is position size times rate, so run it for your usual size on each exchange, with and without the referral figures.

    FAQ

    Which exchange has the lowest futures taker fee in this data?
    OKX and Binance, both at 0.05%. Bybit is at 0.055% and Bitget at 0.06%, while maker fees are 0.02% on all four.

    Does a referral discount change the ranking?
    It might. Bitget lists the largest referral figures (30% discount, 20% cashback), but my data doesn’t say how they combine with the base rate, so check the exchange’s page before drawing a conclusion.

    Can I add a Bybit code after I’ve already signed up?
    Possibly. A main account registered without any code can add an Affiliate code within 14 days of sign-up through “Join an Affiliate’s Community”. Regular user referral codes aren’t accepted, and the code can’t be changed once added.

    This is general information, not investment advice.

  • How to Save on Bybit Trading Fees: Rates, Cashback and the 14-Day Code Window

    This post contains affiliate links. Benefit details were checked on 2026-11-07.

    How much are you paying Bybit in fees every month? And can you get both a fee discount and cashback, or do you have to pick one?

    Those are the two questions worth answering before you change anything. Fees are the one cost you pay on every trade, win or lose, so it helps to know where the savings come from and where they stop.

    What are Bybit’s base fee rates?

    These are the standard rates in the data I checked, taken from Bybit’s fee structure page:

    Market Maker Taker
    Futures 0.02% 0.055%
    Spot 0.1% 0.1%

    On futures, order type matters. The taker rate (0.055%) is more than double the maker rate (0.02%). A taker order removes liquidity from the order book, like a market order or a limit order that fills immediately. A maker order adds liquidity by resting on the book until someone fills it. If you trade futures often, your mix of maker and taker fills shapes your costs.

    Spot works differently. Maker and taker are both 0.1%, so putting a limit order on the book won’t lower your fee percentage, though it can still affect the price you get.

    The first thing to check in your own history is what share of your fills were maker and what share were taker. Your trade history or fee records on Bybit should show it.

    What do the two referral benefits give you?

    Bybit’s referral setup, using code 30638, lists two separate benefits: a 20% fee discount and 20% cashback. The cashback works on a weekly cycle. Every Monday, 20% of the trading fees you paid in the previous week is automatically credited in USDT.

    Can you get both? The data lists both for this code, but it doesn’t spell out how the discount and the cashback combine on a given trade, so I won’t guess at an effective rate. Read the terms shown on the sign-up page, then compare your fee records against the Monday USDT deposits after your first full week of trading.

    It also helps to be clear about what cashback is. It’s a partial refund of fees you’ve already paid, so you pay the fee first and get part of it back the following Monday. That lowers the cost of trading but doesn’t change the rate on each order. If you don’t trade, there’s nothing to refund.

    Is there a welcome bonus?

    New sign-ups may get a welcome bonus of up to $100. Bybit’s wording is that it’s subject to its new-user event terms, so the amount and conditions can differ from one person to the next. Treat “up to $100” as a ceiling and check the event terms in your account before you count on it. Bonuses like this often come with conditions, and Bybit’s own terms are the only place to confirm them.

    What if I already have an account without a code?

    If you signed up without a code, you may still have a way in. The data says a main account registered without a code can add an affiliate code within 14 days of sign-up. You do it through the “Join an Affiliate’s Community” option, and you need to enter an affiliate code, because regular user referral codes are not accepted. Be sure before you submit: once the code is added, it can’t be changed.

    If your account is older than 14 days, this route isn’t available under the rules I checked. If you’re inside the window, confirm the current steps in your Bybit account, since menus and conditions can change.

    How do I sign up with the code?

    If you’re opening a new account, you can use this link:

    Bybit sign-up (referral code 30638)

    Or enter code 30638 during registration. It’s an affiliate link, so if you register through it, I may receive a commission. That doesn’t change what you pay, but you should know about it.

    Before depositing anything, confirm on the sign-up page that the code is applied and the benefits shown match what’s described here.

    How do other exchanges compare?

    Here are the figures from the same data. OKX and Binance base maker/taker fees are not yet verified — check the official page:

    Exchange Futures maker / taker Spot maker / taker Fee discount Cashback
    Bybit 0.02% / 0.055% 0.1% / 0.1% 20% 20%
    OKX 0.02% / 0.05% 0.08% / 0.1% 20% 10%
    Binance 0.02% / 0.05% 0.1% / 0.1% 20% 10%
    Bitget 0.02% / 0.06% 0.1% / 0.1% 30% 20%

    I’m not ranking anyone here, but a few things stand out. Futures maker rates are identical at 0.02% across all four. Bybit’s futures taker rate (0.055%) sits between the 0.05% at OKX and Binance and the 0.06% at Bitget. Cashback is 20% at Bybit and Bitget and 10% at OKX and Binance, and Bitget lists the largest fee discount (30%) in this data.

    Which one saves you more depends on what you trade, spot or futures, and on your maker/taker mix. A lower headline rate doesn’t help much if most of your volume is on a different market than the one you compared.

    How can I check my own numbers?

    You don’t need a spreadsheet, just a short routine. Start with your last month of fees, noting the totals for spot and futures separately. Then look at your maker/taker split on futures. If most fills are taker, the 0.055% rate is the one doing the damage.

    After a full week with the code, compare Monday’s USDT credit against the fees you paid that week; the stated payout is 20% of the previous week’s fees. Read the welcome bonus terms in your account before treating the $100 as part of your plan. And re-check everything now and then, because rates and promotions change, and the Bybit figures here were checked on 2026-11-07.

    Fee savings are real but modest compared to the swings in the market itself. They’re worth setting up once, but they shouldn’t be the reason you trade more often. More trades mean more fees paid, whatever the rebate.

    FAQ

    Can I use the Bybit referral code after I’ve already signed up?
    Possibly. A main account registered without a code can add an affiliate code within 14 days of sign-up via “Join an Affiliate’s Community.” Regular user referral codes aren’t accepted, and the code can’t be changed once added.

    When is the cashback paid?
    According to the data, every Monday, 20% of the trading fees you paid in the previous week is automatically credited in USDT.

    Is the $100 welcome bonus fixed?
    No. It’s listed as “up to $100” and is subject to Bybit’s new-user event terms, so check your own account for what applies to you.

    This is general information, not investment advice.